U.S. Sofa Market’s Reliance on Chinese Imports: Latest Analysis
China’s role in the U.S. sofa market has evolved dramatically—from dominating over two-thirds of imports in 2017 to just 28% by 2024. However, behind this decline lies a deeper reality: China still anchors the global supply chain, even as export patterns shift.
This article breaks down China’s share, the structure of its supply chain, category competitiveness, and future outlook, helping buyers and industry players make informed decisions.

Despite changing trade dynamics and rising regional competition, Chinese manufacturers continue to hold the keys to critical materials and components.
While headline numbers show decline, China maintains a quiet grip through indirect exports and supply chain dominance.
China’s direct market share fell to 28% in 2024, but the actual influence—via Vietnam and Mexico—remains robust.

Key Figures:
- Direct Export Decline
- 2017: $5.33B, 68.6% of U.S. imports
- 2023: ~$3.5B, 35%
- 2024: ~$3.0B, 28%
- Vietnam’s Surge
- 2017: $1.2B → 2024: $9.4B (42% of U.S. imports)
- Powered by 10% tariff rate and labor cost advantage
- Mexico’s Growth
- 2024: 11% of U.S. imports
- Boosted by USMCA and proximity
- Price Band Changes
- Low-End ($500–800): China’s share down from 75% (2018) to 45% (2024)
- High-End: China holds just 7%; Italy and Germany dominate
| Year | China’s Share | Vietnam’s Share | Mexico’s Share |
|---|---|---|---|
| 2017 | 68.6% | 15.5% | ~4% |
| 2023 | 35% | 38% | 10% |
| 2024 | 28% | 42% | 11% |
Supply Chain Characteristics
Even as factories move out of China, the materials and key technologies often still come from Chinese suppliers.
Behind Vietnamese and Mexican sofas, Chinese raw materials and components keep production lines running.

Highlights:
- Dual Export Model
- Direct + Indirect (via Vietnam/Mexico)
- 60% of Vietnam’s fabrics, 40% of metal frames from China
- Mexico sources 50% of leather and 30% of metal frames from China
- Chinese Investment in Southeast Asia
- kuka home: Vietnam output = $1.2B in 2024 (38% of global revenue)
- Raw Material Dominance
- 85% of global high-density sponge production (≥25kg/m³)
- 62% of water-based eco-leather
- 70% of core smart sofa components (e.g., actuators)
| Material/Component | China’s Global Share |
|---|---|
| High-density Sponge | 85% |
| Eco Water-based Leather | 62% |
| Smart Sofa Modules | 70% |
Category Distribution
China’s lead is eroding in traditional categories but remains competitive in emerging segments like modular and metal frame sofas.
The shift is from fabric-covered wood frames to high-tech and structure-intensive sofas.

- Wood Frame Fabric Sofas: Down from 62% (2018) → 34% (2024)
- Economy Leather Sofas: Exports fell 42%; Vietnam seized 55% share
Emerging Categories: Holding Strong
- Metal Frame Outdoor Sofas: 36.5% of U.S. imports
- Competitive due to 98% stainless steel weld yield + 22% cost edge over Mexico
- Modular Sofas ($1,000–2,000): China holds 41% of the segment
| Sofa Type | China’s 2024 U.S. Share |
|---|---|
| Wood Frame Fabric Sofas | 34% |
| Economy Leather Sofas | 28% |
| Metal Frame Outdoor Sofas | 36.5% |
| Modular Sofas ($1K–2K) | 41% |
Policy and Market Dynamics
Tariffs and tax credits are reshaping sourcing choices—but raw material reliance on China continues.
Trade policies create friction, but no country has yet matched China’s scale and supply reliability.

Key Dynamics:
- Tariff Effects
- China: 55% sofa tariff
- Vietnam: 10%
- Result: Vietnamese sofas 30% cheaper in 2024
- U.S. Inflation Reduction Act
- Up to 30% tax credit for North American-made sofas
- Flexsteel expanding capacity in Mexico—but still imports 30% of materials from China
- Consumer Behavior
- Price-sensitive buyers: 68% of sofas in the $500–800 range from Vietnam/Mexico
- Chinese share in this band: just 12%
- Return rate of Chinese products: 20% higher than local brands
Future Trends
Over the next 5–10 years, China may lose some share on paper—but retain real influence through its upstream dominance.
Even as Vietnam and Mexico grow, their reliance on Chinese materials and tech keeps China embedded in the supply chain.

Short-Term (1–3 Years)
- Vietnam’s share expected to rise to 50%
- China’s direct U.S. exports may drop to 25%
- But “Made in Vietnam” products with Chinese components will still capture ~35%
Long-Term (5–10 Years)
- Mexico’s nearshore role may grow to 25%
- But >40% of its materials (metal frames, leather) will still come from China
- If U.S. tariffs rise to 70%, China’s direct exports could drop another 15%
- However, cost inflation from heavy Chinese component use in Vietnam could weaken Vietnam’s price edge by 8–12%
| Projection | Short-Term (1–3Y) | Long-Term (5–10Y) |
|---|---|---|
| China Direct Share | ↓ to 25% | ↓ with risks of 70% tariff |
| Vietnam Share | ↑ to 50% | Stable, but cost pressure |
| Mexico Share | Stable ~11% | ↑ to 25% |
| China’s Influence | ~35% via raw materials | Still >40% supply control |
Conclusion
China’s direct share in U.S. sofa imports is shrinking—but its supply chain dominance remains. For importers, the future lies in managing costs, compliance, and continuity by balancing nearshore assembly with China-backed materials and technology.
Planning a Retail, Distribution, or OEM / ODM Sofa Program?
F-concept Inc. supports B2B sourcing for furniture retailers, distributors, importers, projects, and growing brands. Confirm the selected model, carton plan, sample scope, and order requirements before production.
Related B2B Guides
Related OEM / ODM Products

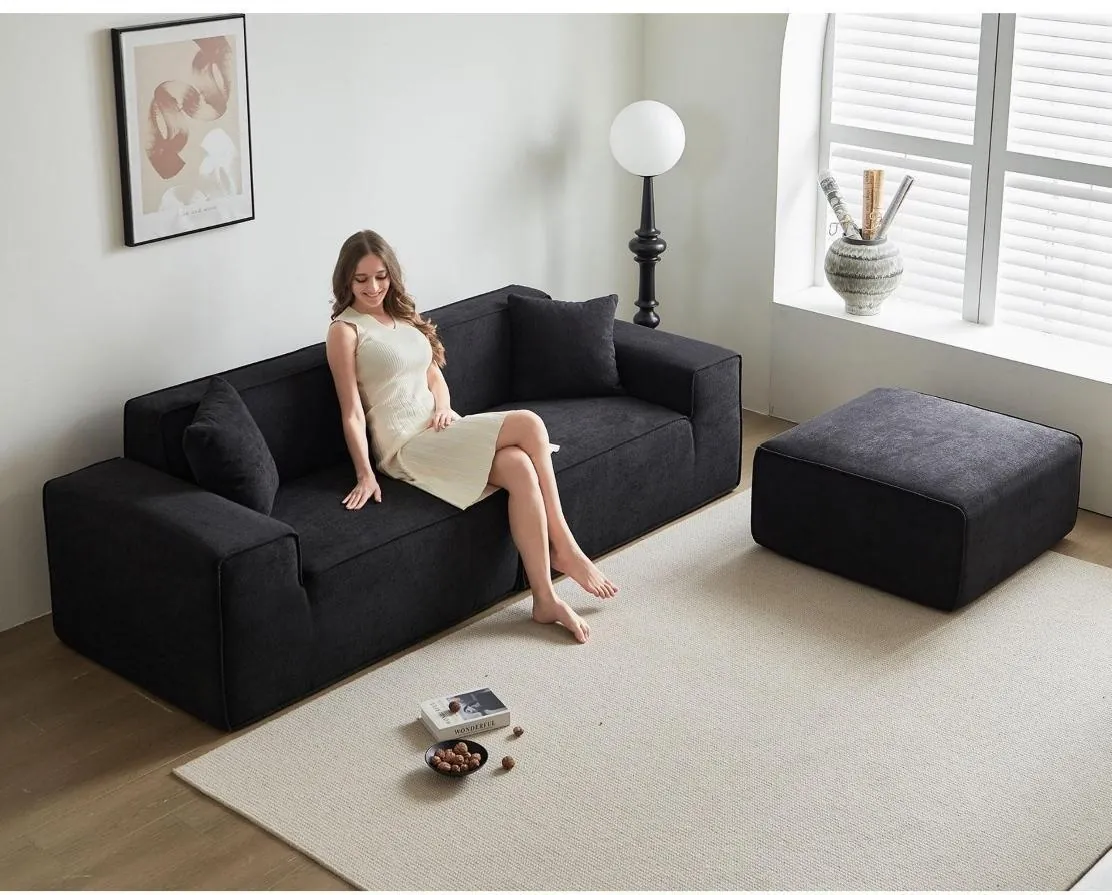
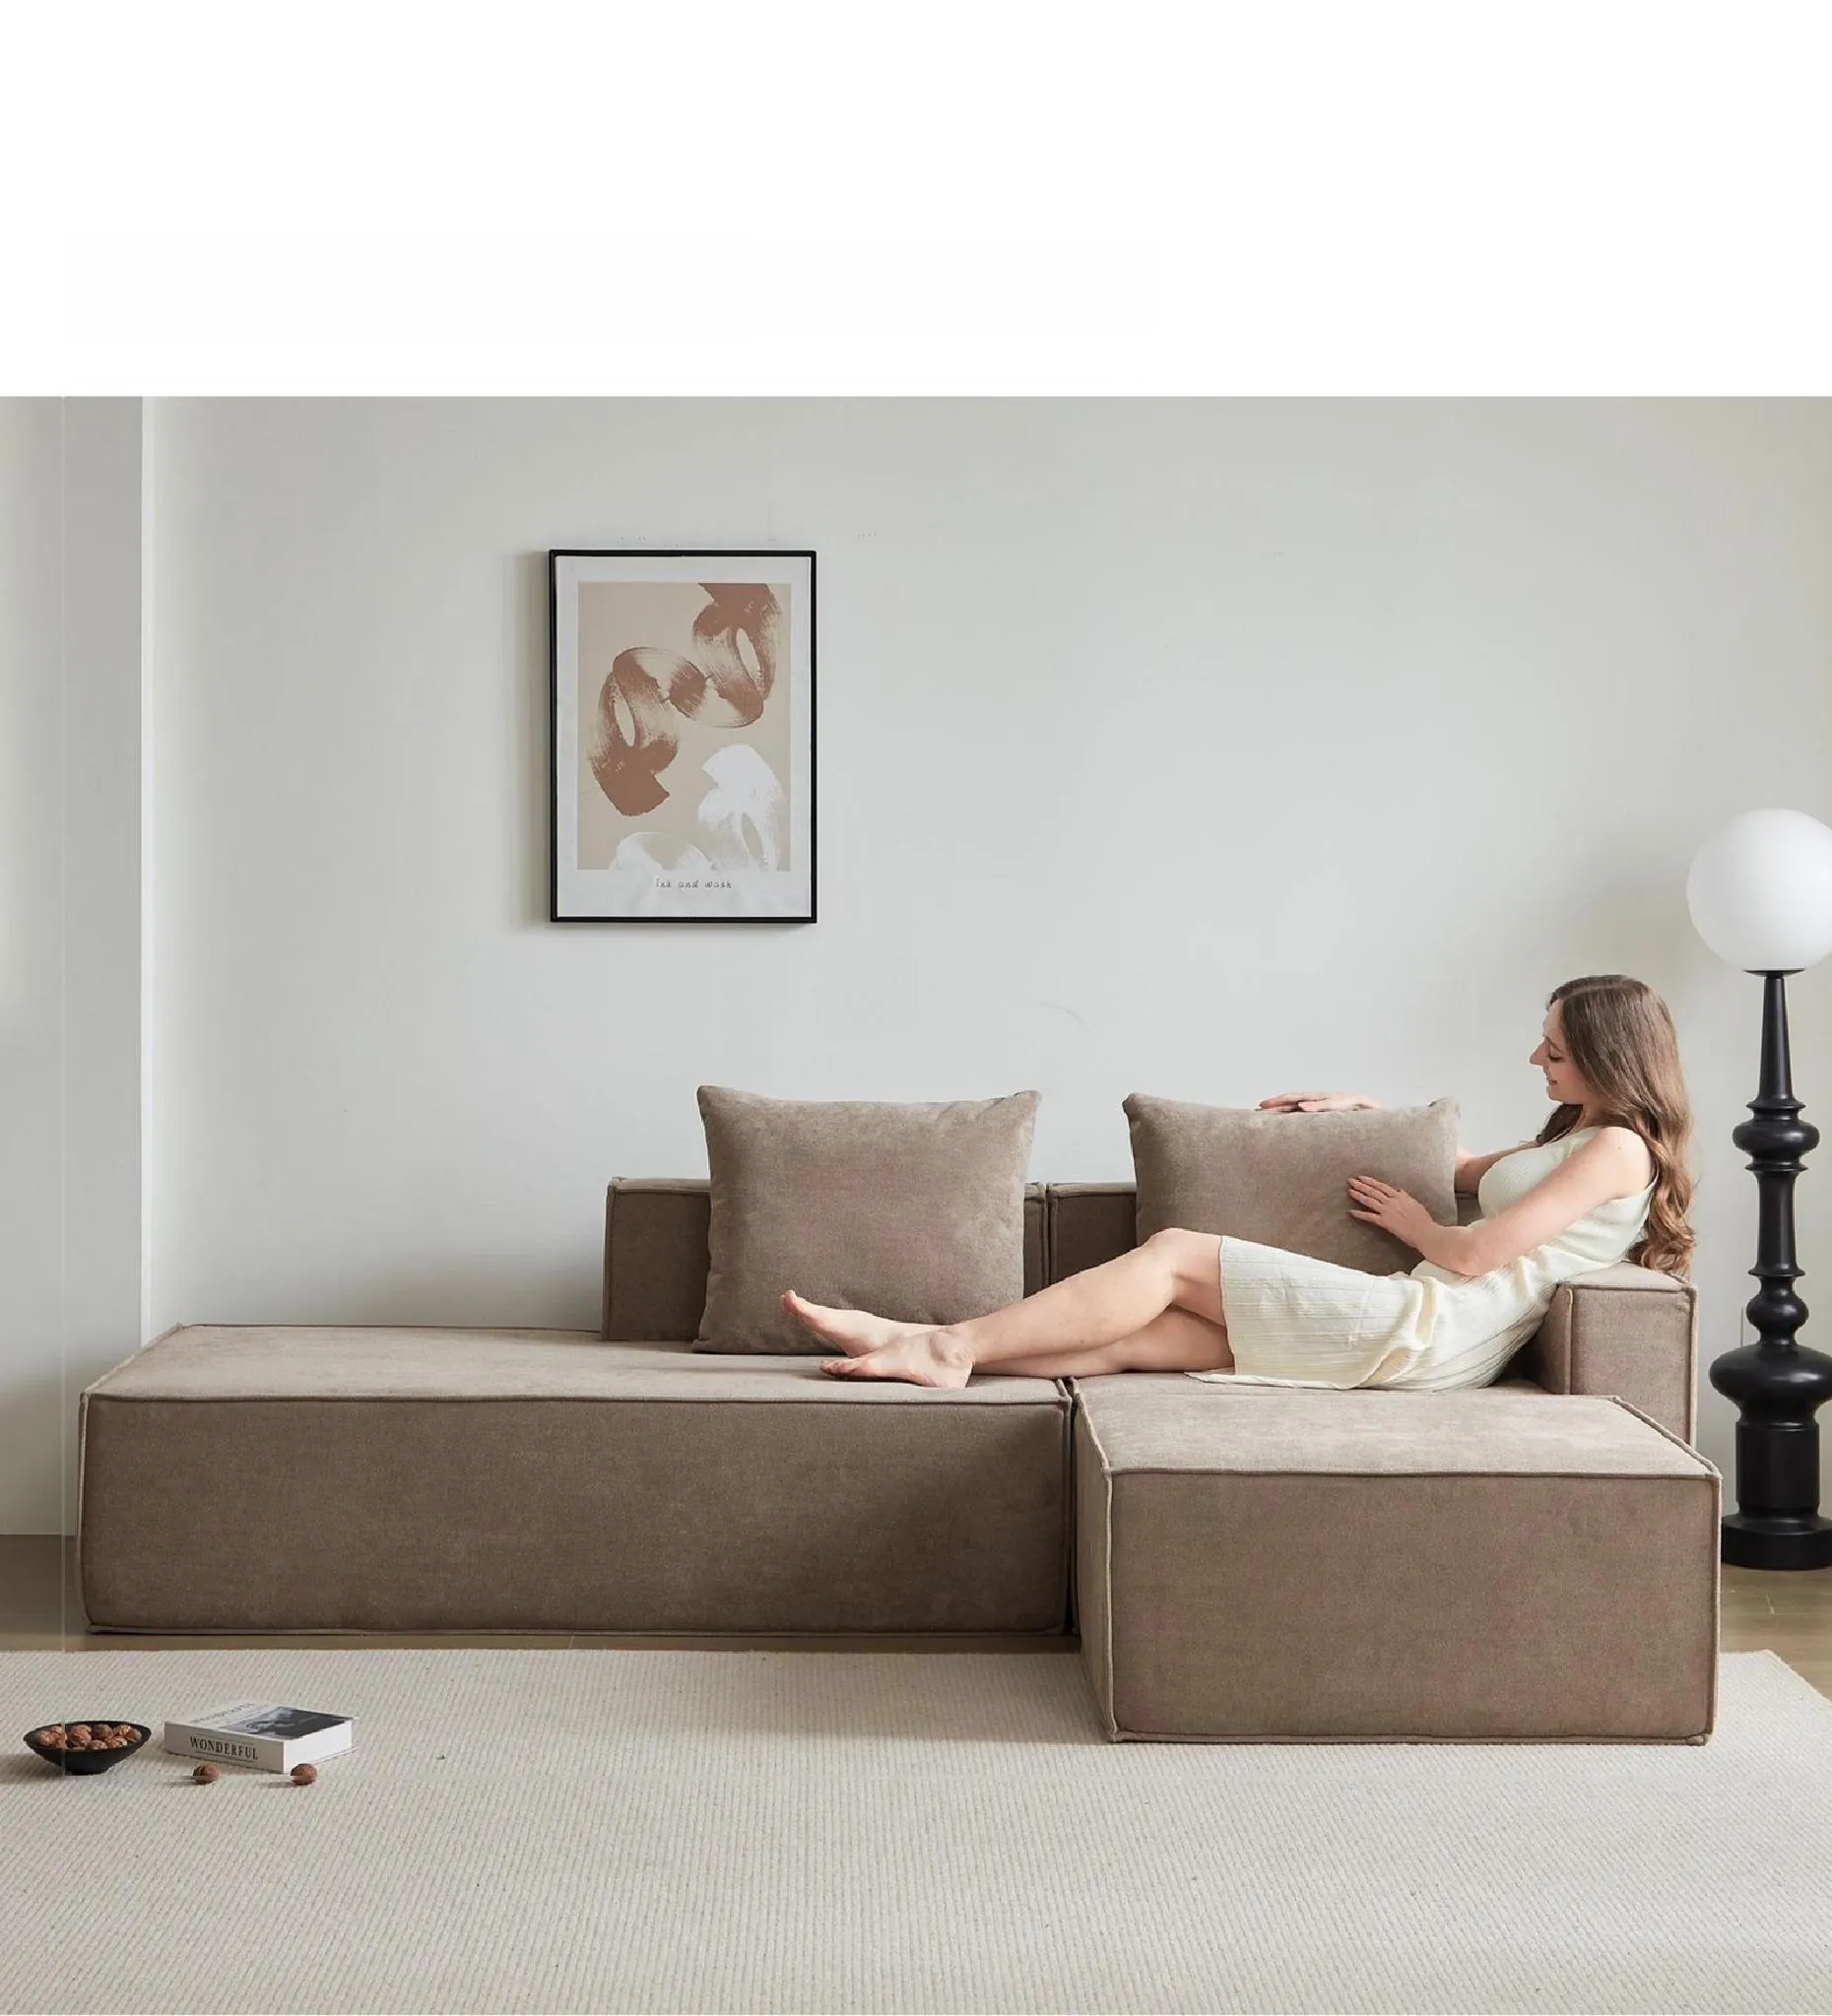
Need Custom Sofa Manufacturing or Wholesale Orders?
Whether you need OEM/ODM manufacturing, white-label packaging, or bulk wholesale from the standard catalog, F-concept Inc. is the source factory you can trust.
For the fastest quote, please provide:
- Target Market / Platform (e.g. Amazon, Wayfair)
- Estimated Quantity (standard bulk MOQ starts at 10 sets per model/color)
- Fabric & Material Requirements
- Target Price Point